Sample:
Exploratory Factor Analysis - KMO and Bartlett's Test
Uzorak dijela rada: Exploratory Factor Analysis - KMO and Bartlett's Test
EFA - Exploratory Factor Analysis

1.The KayserMeyerOlkin KMO value should be higher than 0.5%
and the Bartlett spherical value should be significant with a pvalue less than 0,5%
see the file: xxxxxxxxxxxxxxxx-OK.xlsx
Black text (with language repairs/correction) in the work, and remove background color.
5. The last stage of exploratory analysis is verify if the correct number of factors extracted is higher than 0.6.
Tests of assumptions.
|
KMO and Bartlett's Test |
||
|
Kaiser-Meyer-Olkin Measure of Sampling Adequacy. |
,749 |
|
|
Bartlett's Test of Sphericity |
Approx. Chi-Square |
4989,535 |
|
df |
741 |
|
|
Sig. |
0,000 |
|
Should be significant (less than .05), p<0,001 indicating that the correlation matrix is significantly different from an identity matrix, in which correlations between variables are all zero.
Kaiser-Meyer-Olkin Measure of Sampling Adequacy is 0,749. Should be greater than 0.60 indicating sufficient items for each factor.
2. The commonality for every value should be higher than 0.4% ( Extraction )
These communalities represent the relation between the variable and all other variables (i.e., the squared multiple correlation between the item and all other items).
|
Communalities |
|
|
|
Initial |
|
BC1 - The more expensive cars are my choice. |
,538 |
|
BC2 - The higher the price of a car, the better its quality. |
,897 |
|
BC3 - I prefer to buy the best-selling car brands. |
,991 |
|
BC4 - The most advertised luxury car brands are my choices. |
,938 |
|
BC5 - I am willing to pay higher prices for famous luxury car brands. |
,925 |
|
BC6 - I care about well-known brand names rather than their quality. |
,991 |
|
BC7 - I prefer to buy foreign luxury car brands than local brands. |
,845 |
|
MA8 - It makes me feel comfortable when I have things that impress people. |
,683 |
|
MA9 - I think acquiring luxury cars can be seen as an achievement in life. |
,808 |
.....
|
Extraction Method: Principal Axis Factoring. |

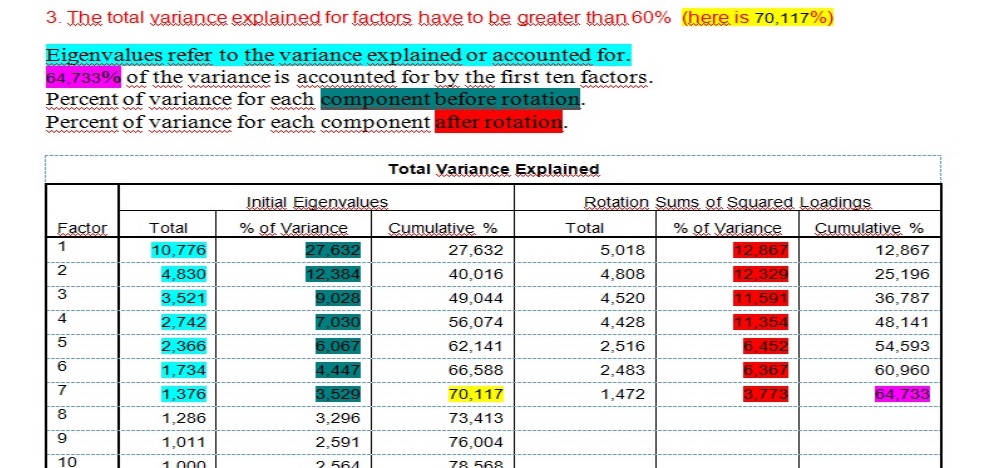
3. The total variance explained for factors have to be greater than 60% (here is 70,117%)
Eigenvalues refer to the variance explained or accounted for.
64,733% of the variance is accounted for by the first ten factors.
Percent of variance for each component before rotation.
Percent of variance for each component after rotation.
|
Total Variance Explained |
||||||
|
Factor |
Initial Eigenvalues |
Rotation Sums of Squared Loadings |
||||
|
Total |
% of Variance |
Cumulative % |
Total |
% of Variance |
Cumulative % |
|
|
1 |
10,776 |
27,632 |
27,632 |
5,018 |
12,867 |
12,867 |
|
2 |
4,830 |
12,384 |
40,016 |
4,808 |
12,329 |
25,196 |
|
3 |
3,521 |
9,028 |
49,044 |
4,520 |
11,591 |
36,787 |
EFA - Exploratory Factor Analysis - Scree Plot - Rotated Factor Matrix